To aid those weathering the uncertainties of how 2021 will impact the commercial collision industry, we at PPG are sharing some benchmarking insights and trends, compiled from our ADJUSTRITE ® Commercial Estimating system, from 2018 thru 2020— including both insurance and shop estimates from the United States and Canada. For all metrics, except severity, the information excludes known total losses.
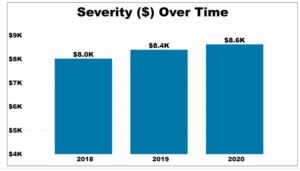
Severity trends reflect an industry experiencing increased complexity or
year-over-year increases.
In contrast to the approximate 4.7% increase in claim severity from 2018 to 2019, excluding total losses, there was a 2.7% increase from 2019 to 2020. The average claim severity in 2020 was $8,620.
(For all estimates including total losses, there was a 10.4% increase in severity in 2020, compared to 2019, with an average claim severity of $10,288.)
Total parts’ dollars also showed year-over-year increases. For 2018 to 2019, the average total parts’ dollars increased 3.3%. There was a 2.9% increase for 2019 to 2020.
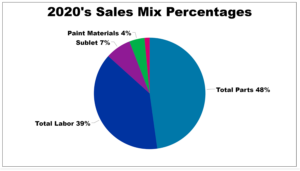
Average total parts ‘dollars per estimate in 2020 was approximately $4,120. Total labor dollars also saw increases year-over-year.
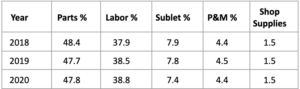
From 2018 to 2019, total labor dollars increased 6.3%, and there was a 3.7% increase in 2020, over 2019. Table 1 provides a 3-year view of sales mix percentages.
Table 1: Sales Mix Percent for CY 2018 – CY 2020
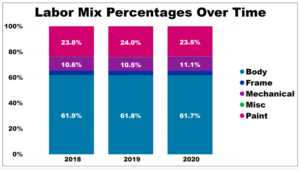
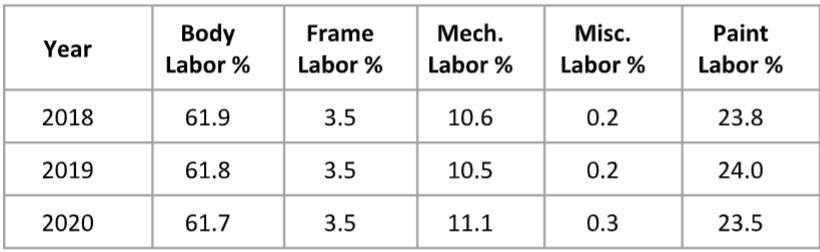
With labor dollar increases outpacing others, it is critical to review the labor mix percentages over the past three years, which averaged 61.8% body, 3.5% frame, 10.7% mechanical, 0.2% miscellaneous and 23.8% paint.
The 3-year trend saw a move of less paint and body to more mechanical and miscellaneous labor percentages. Table 2 provides a view of each year.
Table 2: Labor Mix Percent for CY 2018 —CY 2020
94.0% of estimates with body labor. The 3-year average percentages of estimates for each labor type were as follows:
-
- 7.9% with frame labor
- 23.9% with mechanical labor
- 1.2% with miscellaneous labor
- 71.0% with paint labor.
From 2019 to 2020, there were increases in estimates with frame and mechanical labor, and a decline in estimates with paint, body, and miscellaneous labor. Table 3 provides a view of each year.
Table 3: Percent of Estimates with Each Labor Type for CY 2018—CY 2020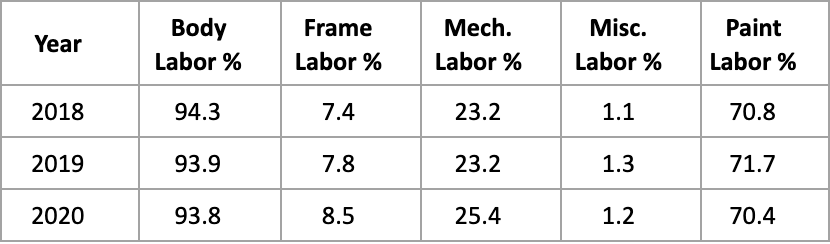
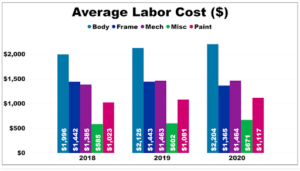
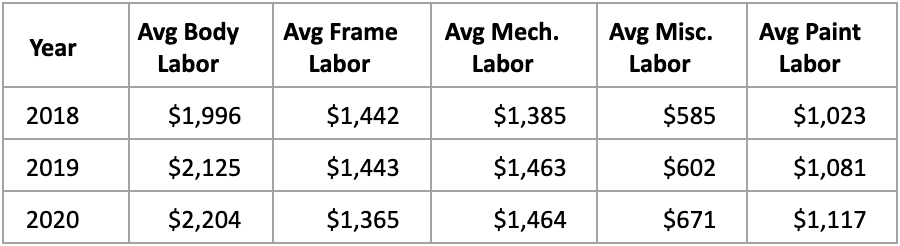
Table 4: Average Labor Dollars for CY 2018—CY 2020
A review of the 3-year trend for average labor dollars shows that all labor types experienced a year over year increase except frame and mechanical labor dollars. Frame labor dollars were flat from 2018 to 2019, however were down 5.4% from in 2020. Mechanical labor dollars increased in 2019 over the previous year, however remained flat in 2020. Miscellaneous labor dollars saw a double- digit increase of 11.5% from 2019 to 2020. Table 4 provides a view of each year.
In the parts count category, the 3-year average for number of parts per estimate is 23, with OEM parts used 95.5% of the time. When comparing average parts dollars for 2020, the OEM average part cost was $247—recycled parts was $1,433, and aftermarket new was $335. The split between repair and replace labor dollars in 2019 and 2020 amounted to 42% for repair and 58% for replace. “Front” was the most often flagged primary impact area in 2020, followed by “Right Front” then “Left Front.”
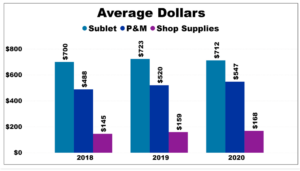
The 3-year average for sublet dollars per estimate is $711, with the average down 1.5% in 2020. From 2018 to 2020, paint and material dollars showed year over year increases of 6.6% and 5.2% respectively. Average paint and material dollars per estimate in 2020 numbered $547. Average shop supplies per estimate in 2020 was $168, an increase of 6.2% over 2019.There was a larger increase in shop supplies in 2019, over 2018.
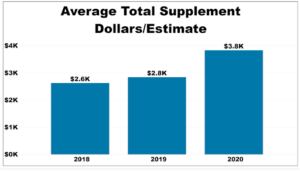
Since 2018, the total supplement amount per estimate has continued to rise, increasing by 8.2% in 2019 and 34.8% in 2020. The average total supplement cost was approximately $3,800 in 2020 The percent of estimates with supplements increased from 25.9% in2018 to almost 28% in 2019. Last year saw that percentage drop to 24.2%, with 71.9% of those estimates having only have one supplement. Supplement dollars represented 33 – 34% of severity in 2018 and 2019, while 2020 saw that number increase to 44%.
Thank you for allowing us to provide you with insights compiled from our AdjustRite Commercial Estimating system. All of us at PPG Industries wish you the best of success in 2021! If you have any questions regarding our commercial estimating system, feel free to contact Ryan Woolfenden, PPG marketing manager, commercial programs, at woolfenden@ppg.com.
About AdjustRite:
The AdjustRite ® Commercial Estimating system is an industry-leading platform in the medium-to-heavy-duty equipment repair and claims industry. The system is a Web-based, fully mobile application, driven by a comprehensive database of commercial vehicles and equipment including: tractors, trailers, trucks, boxes, motor coaches, RVs, and buses. To learn more about the AdjustRite Commercial Estimating System, visit www.adjustrite.com .